Information Dashboard

Overview
Use this dashboard to monitor the total Bitstreams server utilization.
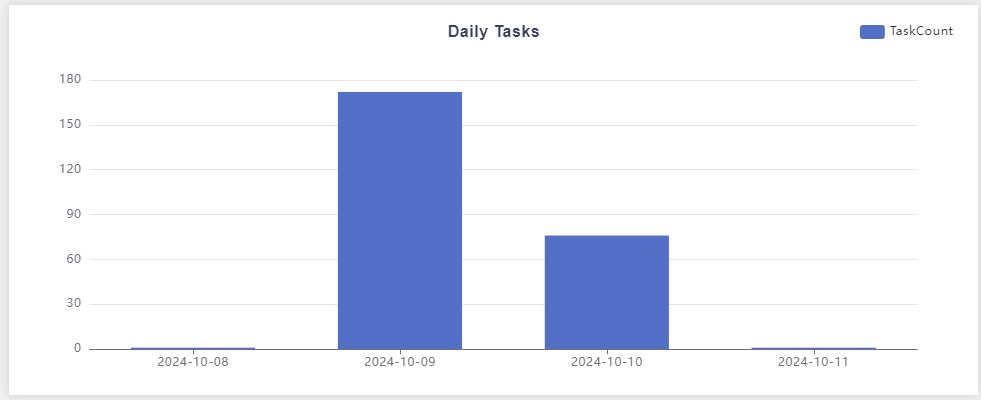
Daily Tasks
The graph provides an overview of the number of task created per day over the last four days.
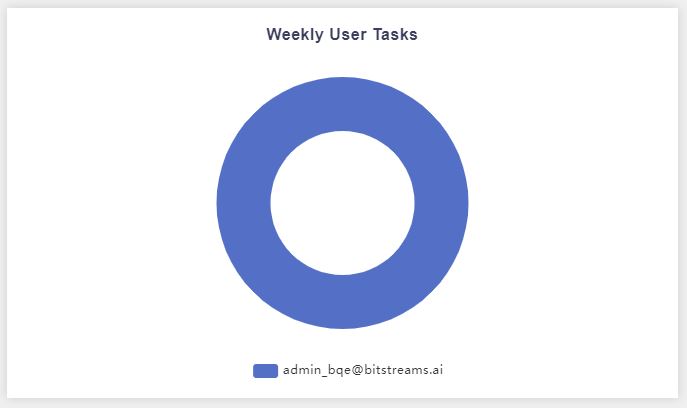
Weekly Tasks
The graph provides an overview of the number of task created per week over the last week.
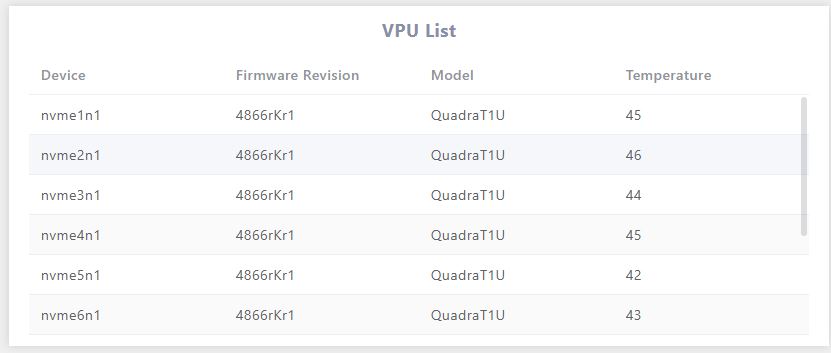
VPU List
This table shows all the VPUs that are available for Bitstreams Edge.
| Term | Description |
|---|---|
| Device | The host system device name. |
| Firmware Version | Firmware version installed on the VPU. |
| Model | VPU model number. |
| Temperature | Current temperature of the VPU. Refer to the Warning note below. |
Temperatures above 70 will cause the VPU to enter into a throttling state which will cause a reduction in capacity.
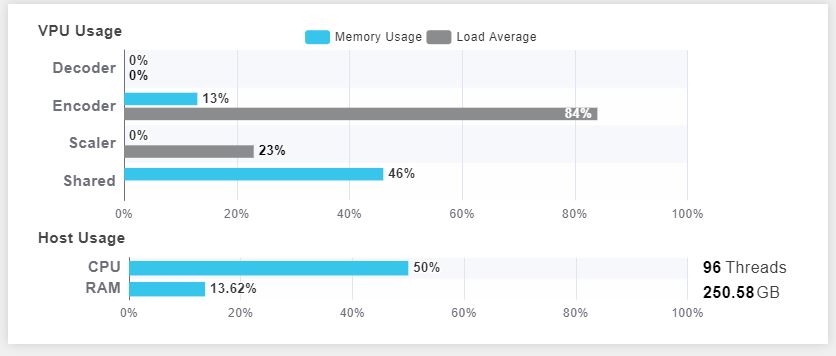
System Usage
VPU Usage
The VPU usage graph contains both the load of the decoder, scaler and encoding along with the memory usage. The graph is an average across all available VPUs.
It is recommended that any usage graph should remain unber 80%. The user is allowed to exceed this value but the perfromance may not be as expected.
| Term | Description |
|---|---|
| VPU Encode % | Total percentage of the Video Processing Unit (VPU) dedicated to encoding tasks. |
| VPU Decode % | Total percentage of the VPU dedicated to decoding tasks. |
| Scaler % | Total percentage of the VPU dedicated to scaling tasks. |
| Shared | Total percentage of the shared memory being used on the VPU. |
Host Usage
It is recommended that any usage graph should remain unber 80%. The user is allowed to exceed this value but the perfromance may not be as expected.
| Term | Description |
|---|---|
| CPU % | Total percentage of the CPU's processing power being utilized. |
| Memory % | Total percentage of memory (RAM) utilization on the server. |